Volatility Dashboard
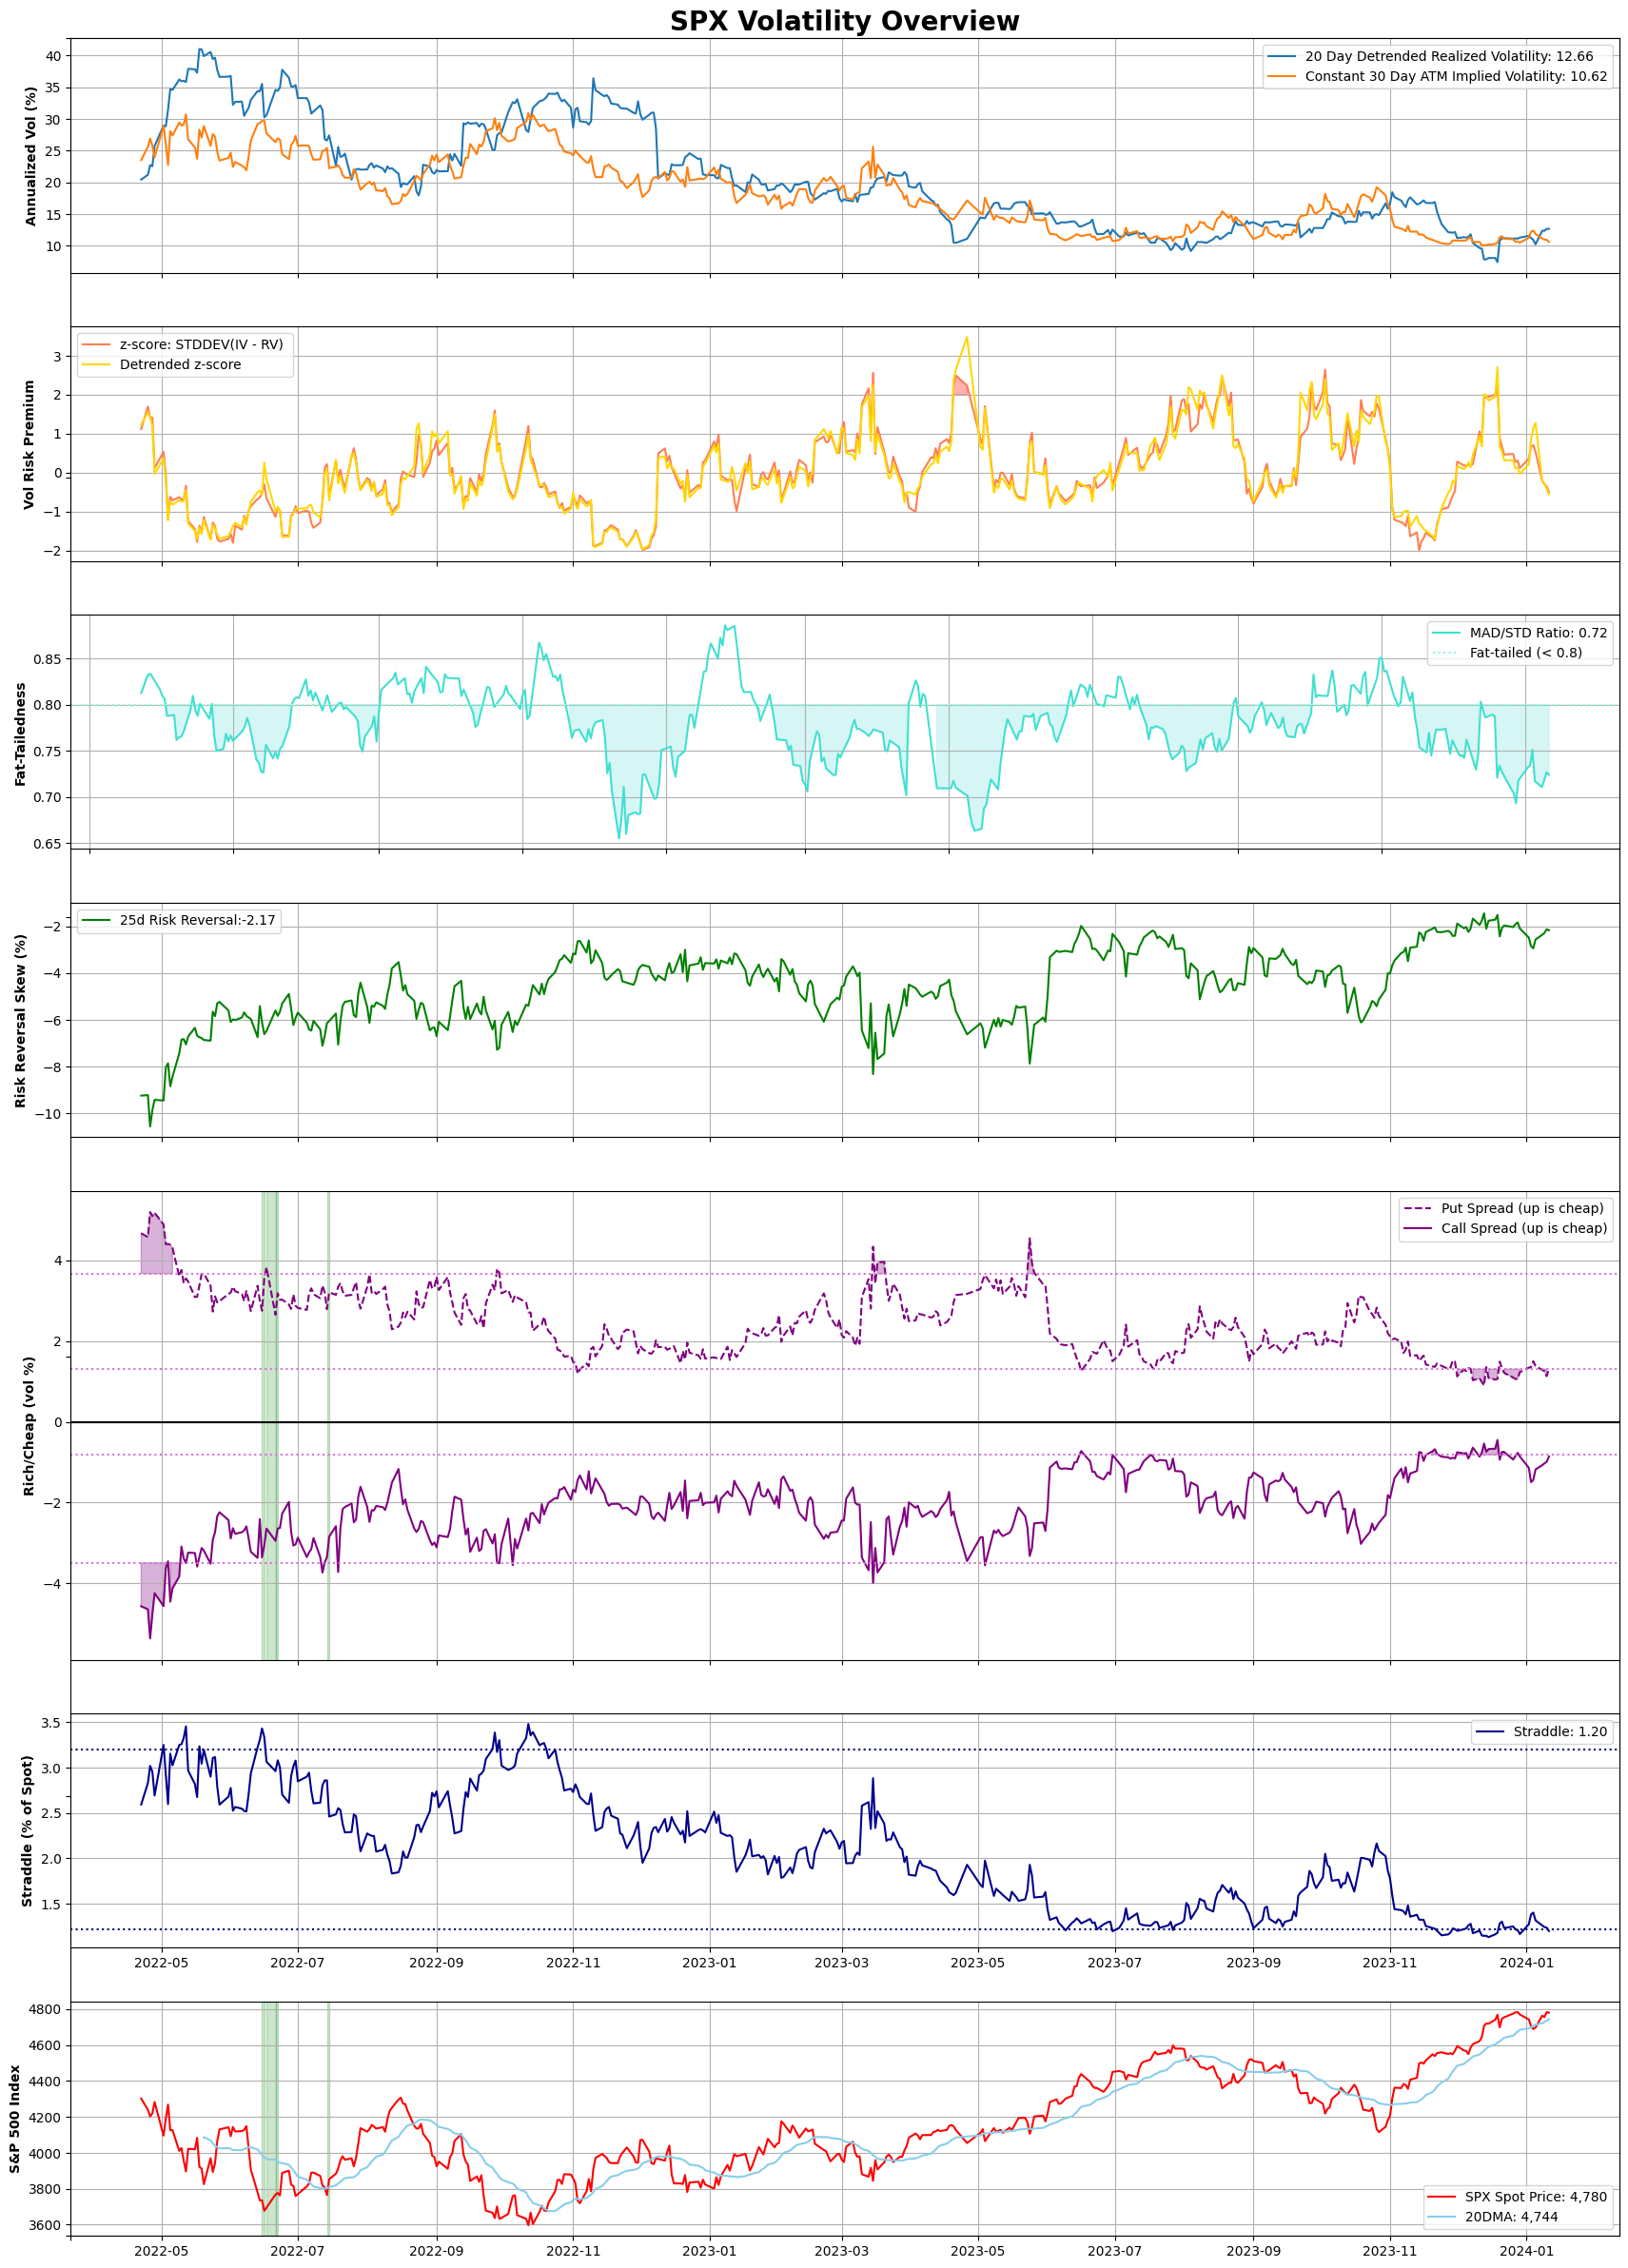
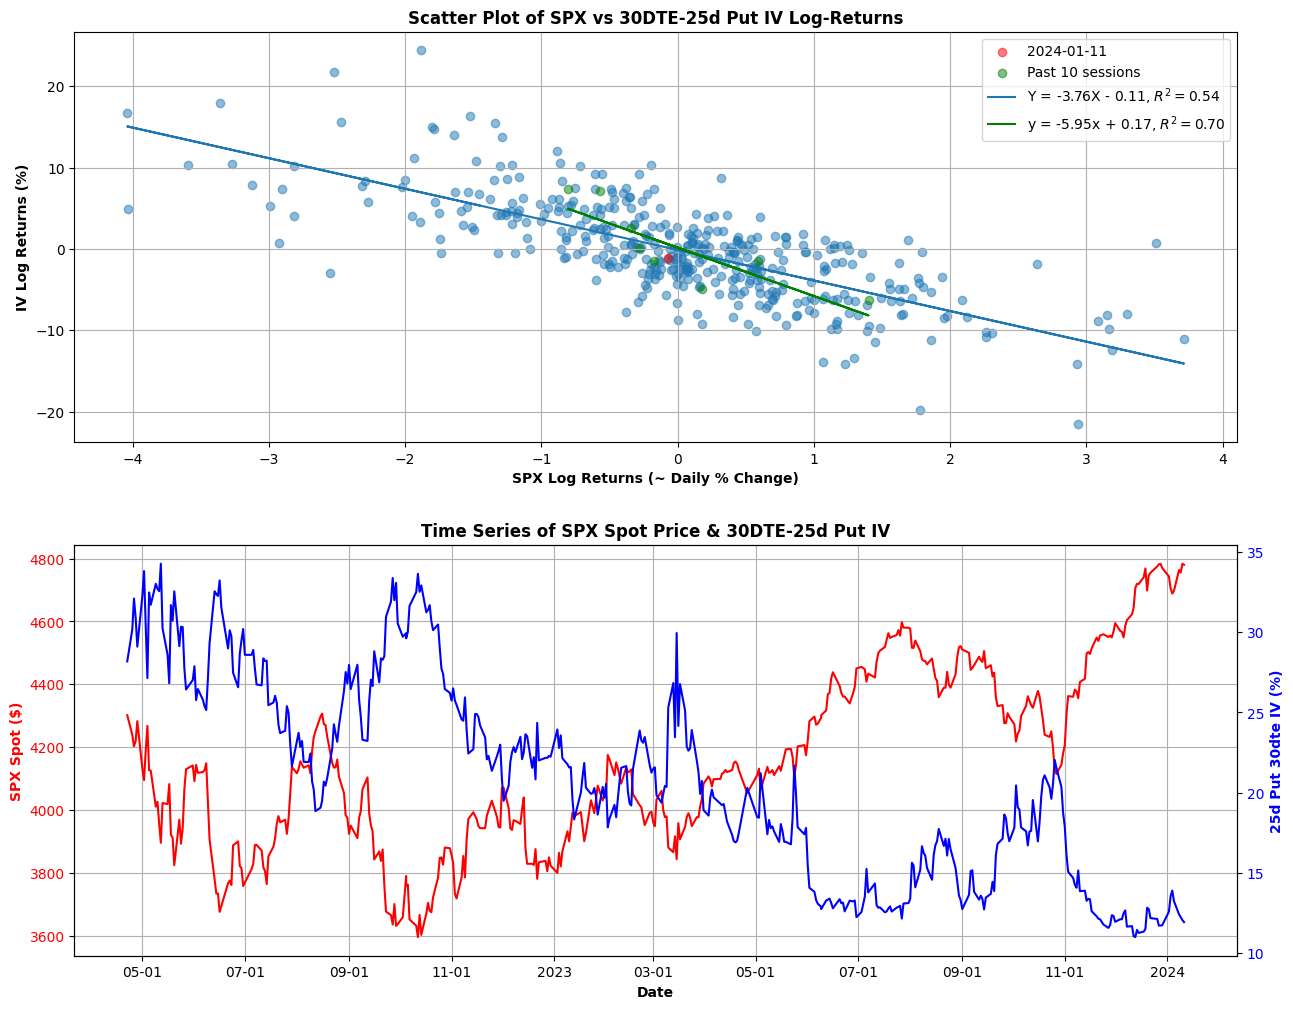
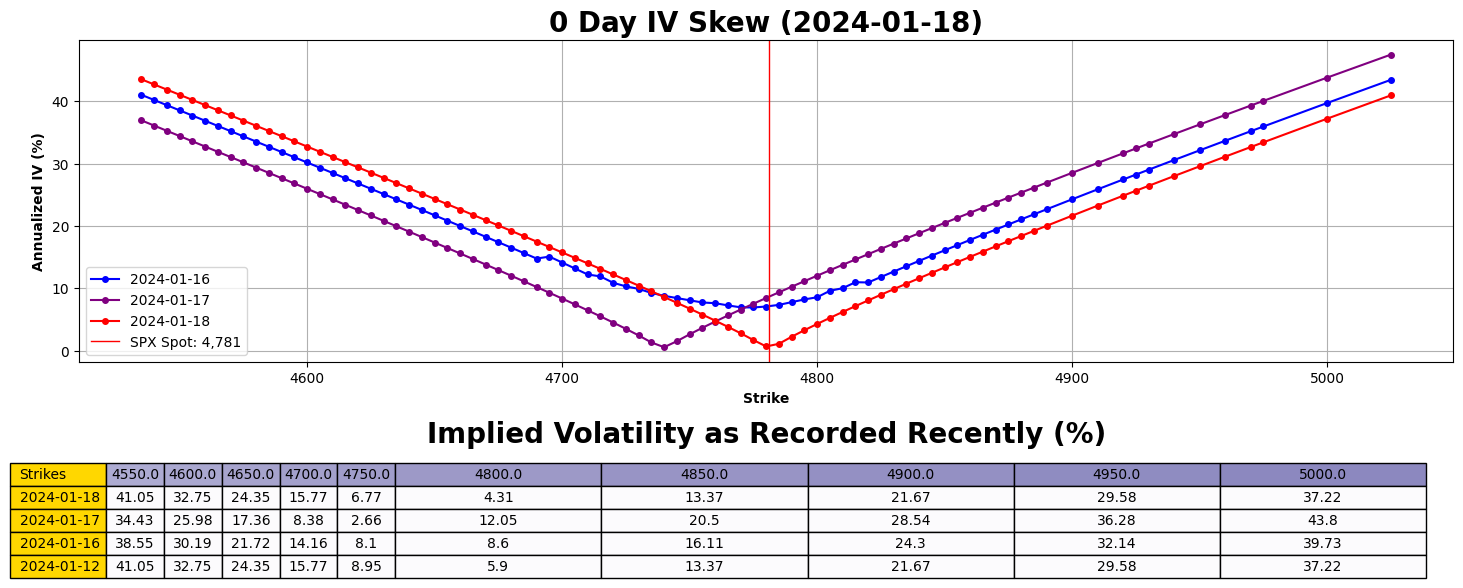
Welcome to the intricate world of volatility! Here, you will find a series of comprehensive charts and analyses that track the ebbs and flows of volatility in the S&P 500 Index. Each chart is meticulously curated to highlight different aspects of market volatility – from short-term fluctuations to long-term trends.
Viewing Large Images: We understand that some of the images on our site are quite detailed and large. To view these images in their full glory, we recommend right-clicking on the image and selecting “Open Image in a new tab.” Enjoy exploring the finer details!


×