Gamma Exposure

Hey there! For a deeper understanding and better appreciation of the charts, I highly recommend checking out my post on GEX first. It’s packed with insights that will enhance your experience. Happy reading!
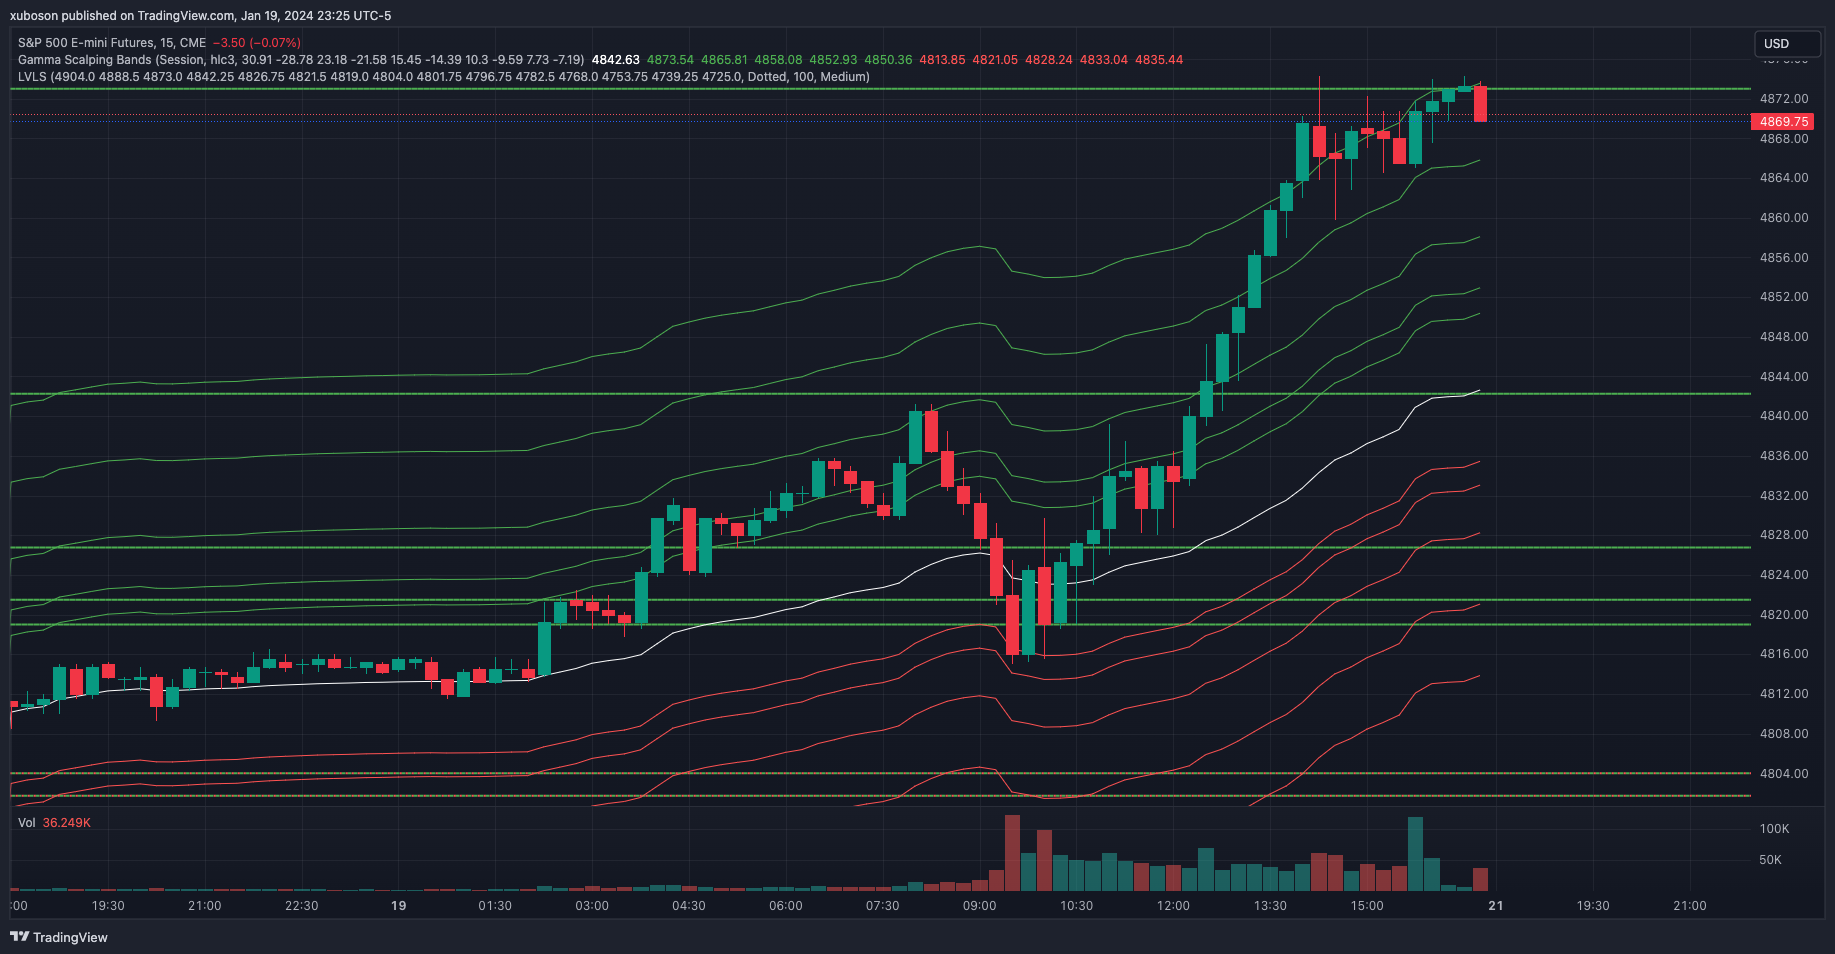
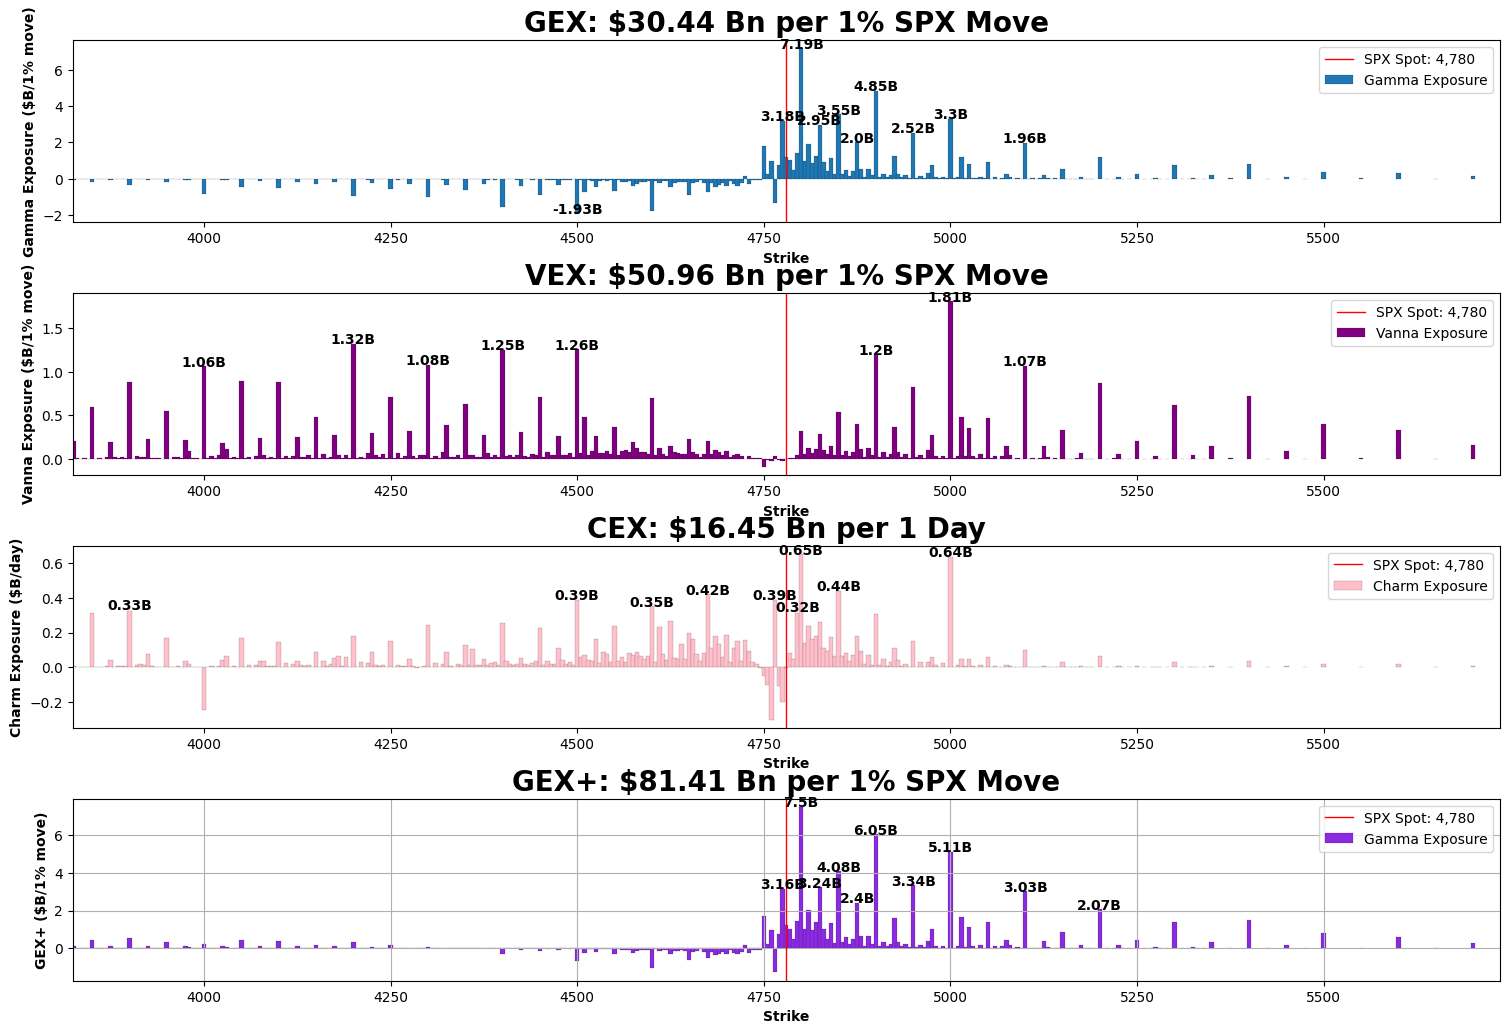
Figure 1: Gamma Bands -- Daily Levels of Supply and Demand due to GEX.
Figure 2: Estimated dealer Gamma, Vanna, and Charm exposures in the S&P 500.
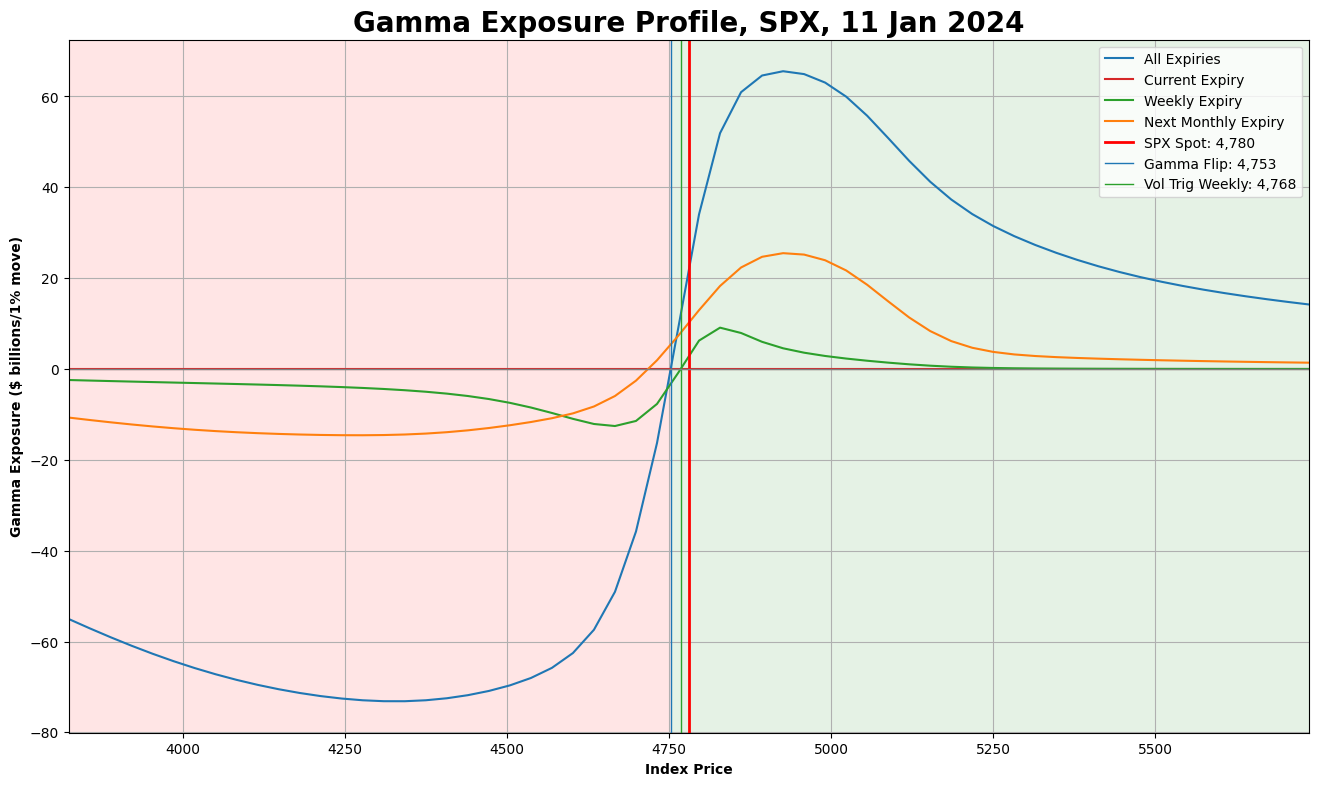
Figure 3: Dealer Gamma as a function of spot price.
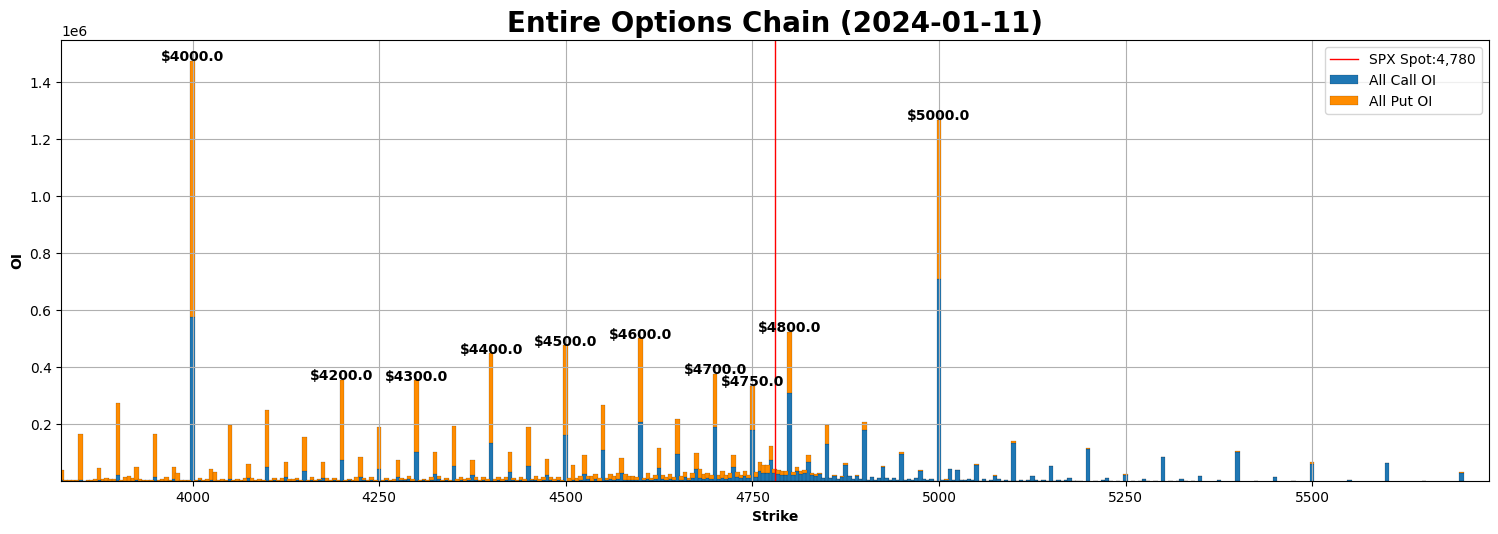
Figure 4: Aggregate interest at each price point. An estimate of what the market is expecting.
Figure 5: The change in aggregate interest since the last trading day.
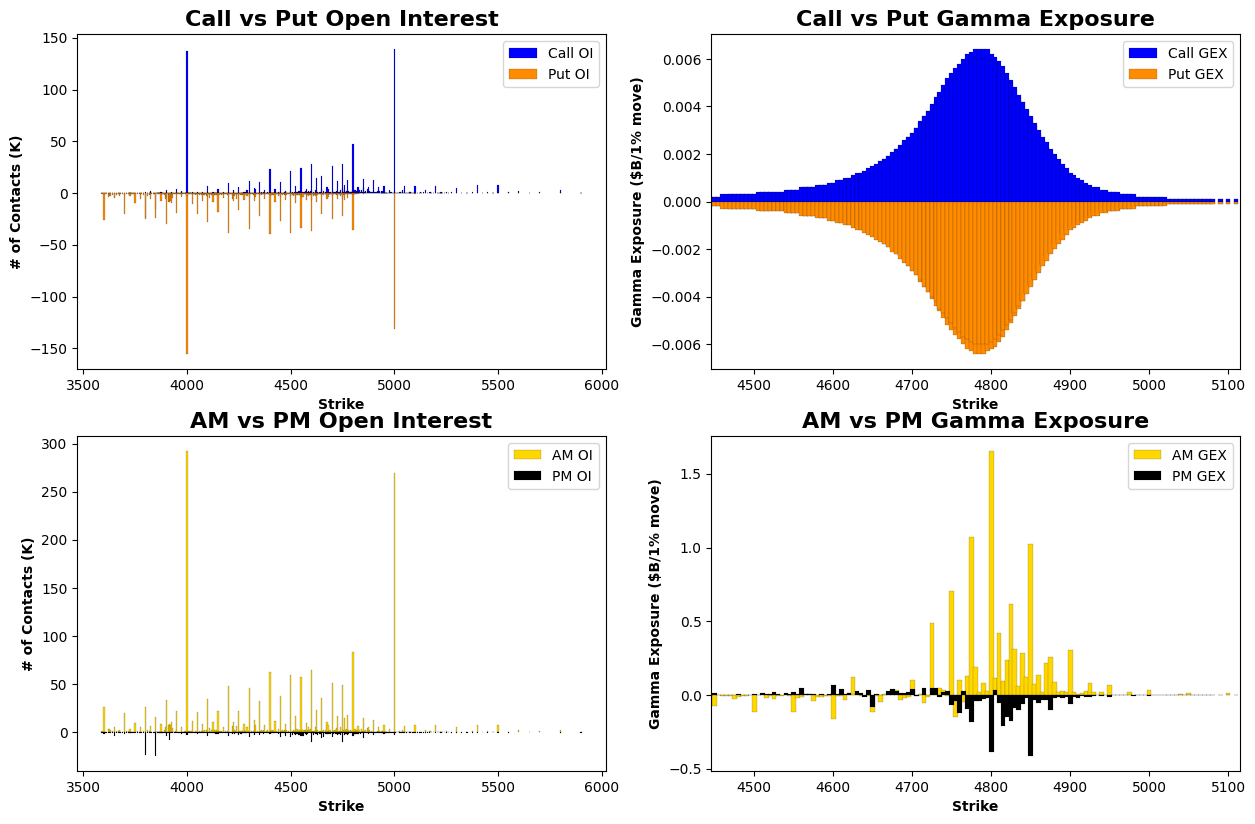
Figure 6: Interest and Gamma Exposure for large options expirations.